By Ramachandran Rajeev Kumar — 2026-05-08
The Indicator the Headlines Ignored: What 8.1 Per Cent Steel Demand Is Telling Us
The Joint Plant Committee's April release this week carried a number that ought to have moved the needle on the macro conversation and largely did not. India's finished-steel consumption rose 8.1 per cent year-on-year in April 2026. Long-product and flat-product prices firmed alongside the volumes. Inventories at major integrated mills tightened.
In a week dominated by the Iran war, the FII outflow, and a Reserve Bank deputy governor floating an inflation regime change, this number sat below the fold. That is a mistake. Steel demand is one of the half-dozen indicators that tells us, before the headline GDP print, what the actual underlying economy is doing. And what it is currently telling us is worth understanding precisely.
Why steel matters as an indicator
Steel is uninteresting as a commodity story. It is fascinating as a leading indicator. The reason is structural.
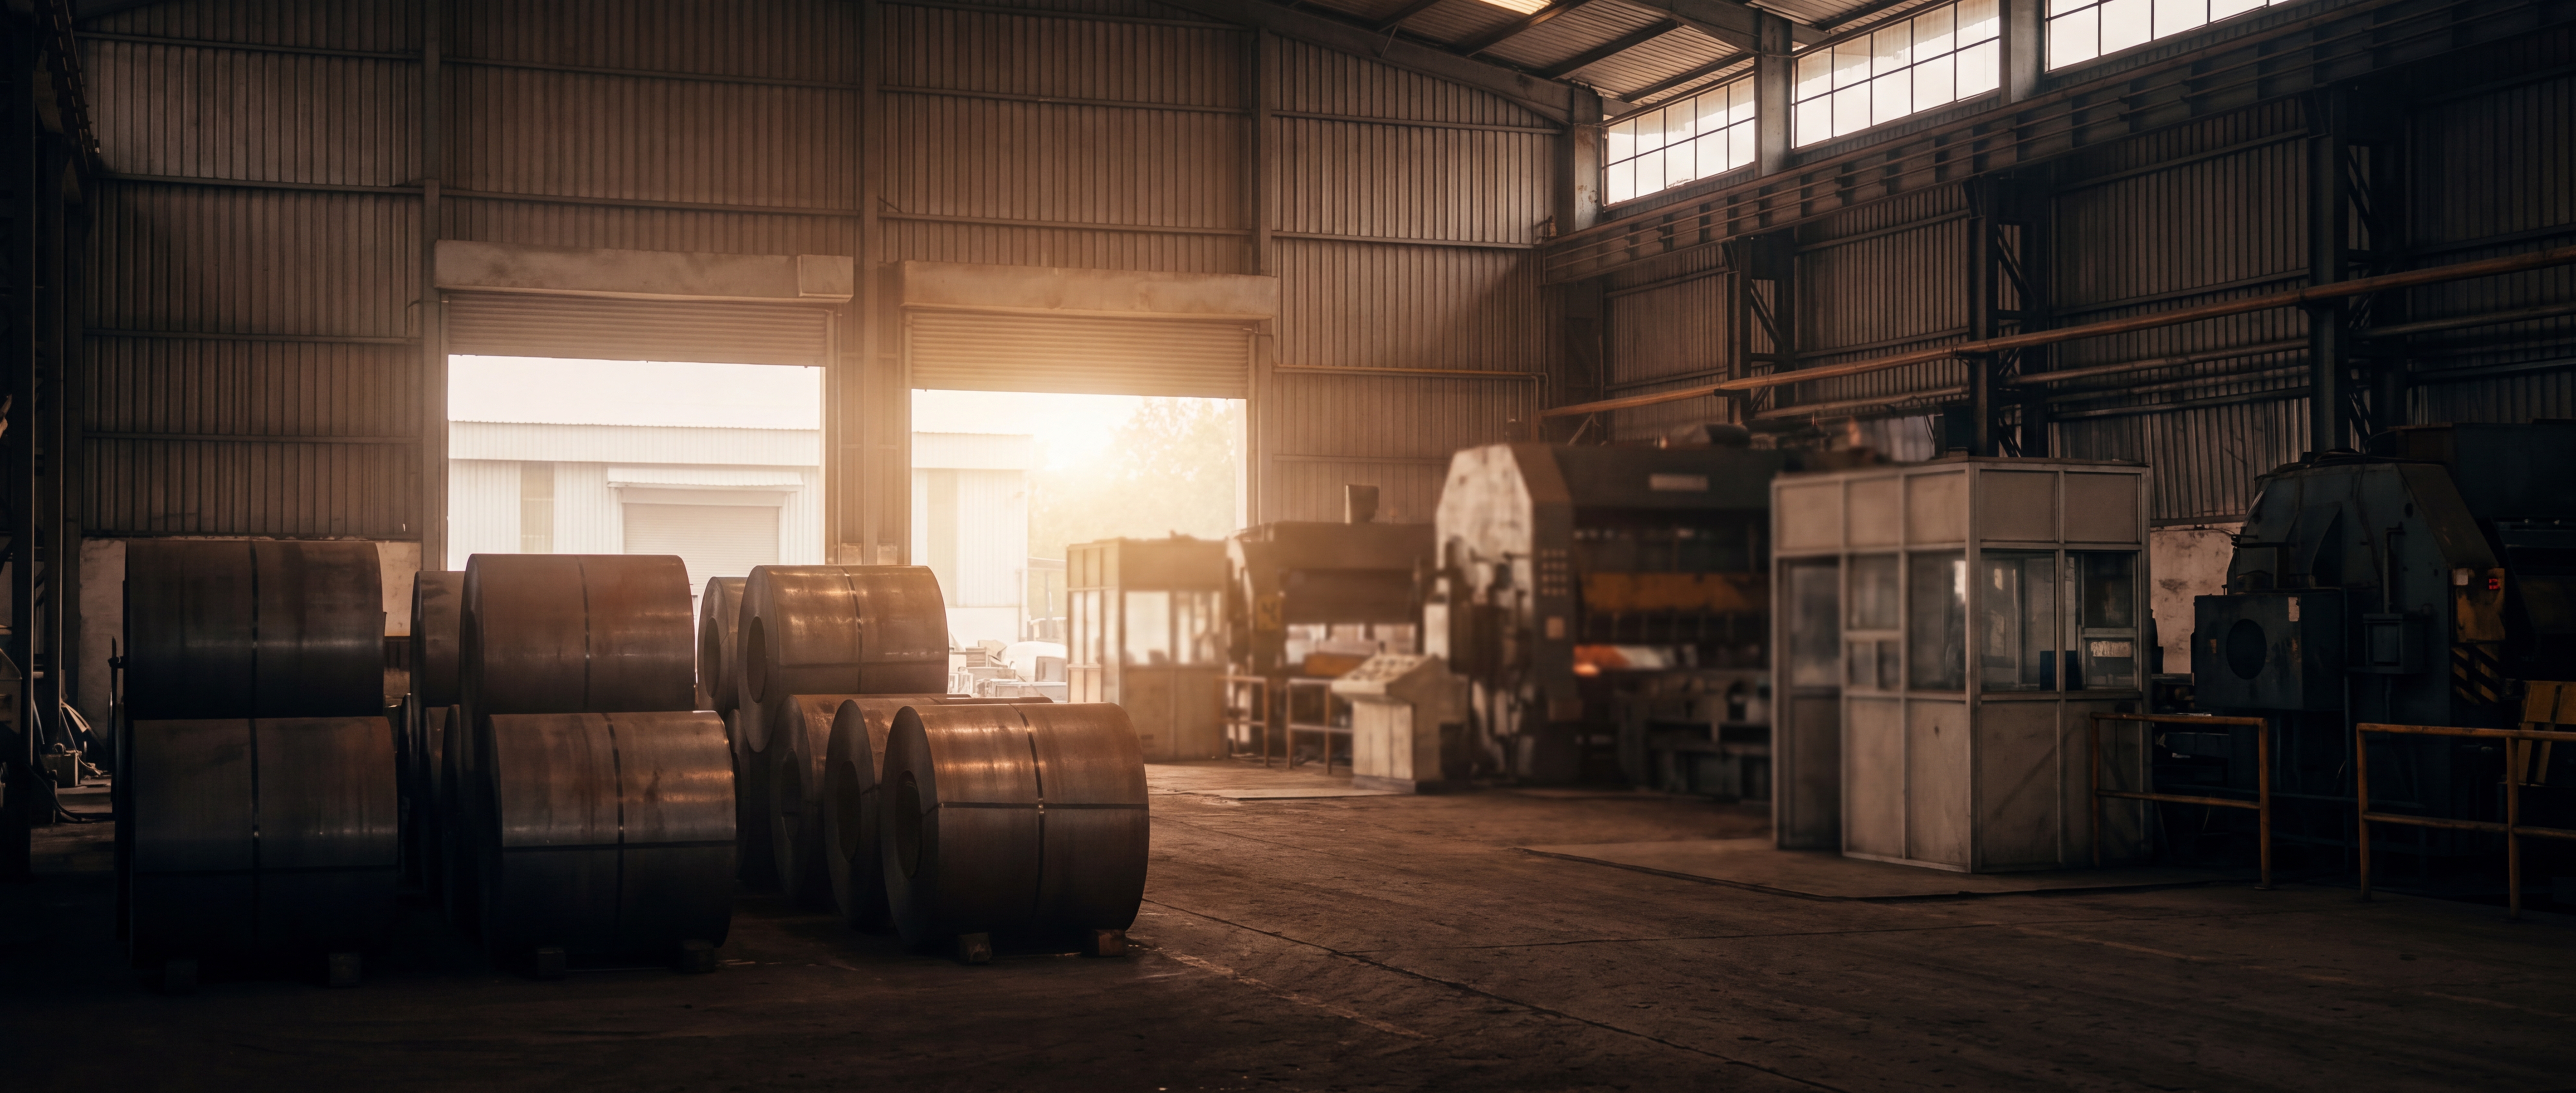
Roughly 30 per cent of Indian finished steel goes into construction — buildings, both residential and commercial. Another 25 per cent goes into infrastructure — railways, highways, metros, ports. About 15 per cent goes into capital goods and industrial machinery. The rest is distributed across automobiles, packaging, white goods and intermediate consumption.
Each of those end-uses sits at the front of an investment decision. A real-estate developer commits to a steel order three to six months before pouring concrete. A capital-goods manufacturer commits to steel input twelve weeks before delivering a machine. A railway contractor commits to track and structural steel twelve months before completing a section. The steel tonne, therefore, prices in tomorrow's GDP — not yesterday's.
This is why central banks, equity strategists, and rating agencies watch the steel print as a leading indicator. The headline GDP print is a rear-view mirror. The steel print is a windshield.
What the 8.1 per cent number actually says
There are three things to know before we read the number.
First, this is real consumption, not production. The mills can run hot for inventory reasons or for export reasons. Consumption strips both effects out and tells us what the Indian economy actually absorbed. Eight per cent real consumption growth, sustained, would be an economy growing at well above 7 per cent in real GDP terms.
Second, the comparison base is real. April 2025 was not a depressed month. The base-effect explanation that we use to dismiss good prints from bad years does not apply here. Consumption is up against a normal base, not a Covid base or a demonetisation base.
Third, the price action confirms the volume action. When prices rise alongside volumes, the demand is pulling the market. When volumes rise but prices fall, the demand is being pushed by mills clearing inventory at discount. April 2026 is the former pattern — demand pulling, not supply pushing. That is a much more reliable signal.
Where the demand is coming from
Three components have driven the print.
The first is government infrastructure. The capex disbursement pattern from the Ministry of Railways, the Ministry of Road Transport and Highways, and the urban metro programme has finally hit its stride after several years of front-loaded budgeting and back-loaded execution. The fourth quarter of FY26 saw the largest disbursement of any quarter in the programme's history. Steel orders for the Mumbai-Ahmedabad bullet-train final section, the Western Dedicated Freight Corridor extensions, and the next two tranches of metro projects are all flowing through the April numbers.
The second is private real estate. The luxury and premium segments have been running hot for eighteen months — that is well known. What is less well covered is that the mid-market and affordable segments, which had remained sluggish, have begun showing measurable revival in the last two quarters. New project launches in the affordable segment in the top eight metros rose double-digits in March, and the steel orders that follow those launches are now arriving at the mills.
The third — and this is the genuinely interesting component — is private industrial capex. Capital-goods steel orders, which had been the missing leg of the recovery story for three years, have visibly turned. The Production-Linked Incentive disbursements, the data-centre build-out, and the early-stage semiconductor fabrication facilities have all moved past the planning phase and into the steel-ordering phase. This is the component that several brokerages had been writing off as still 12-to-18 months away. It appears to have arrived earlier than expected.
The case against over-reading
A single month does not make a cycle. The 8.1 per cent print needs to be read with at least three caveats.
A part of the surge reflects pre-monsoon order pulling-forward, where developers and contractors place orders before the construction-disrupting rains arrive. The May number will be a more honest test than the April number.
A part of the print reflects price-stocking by traders who expect input-cost rises later in the year — Iran-driven coal-coke price action being the obvious driver. That demand is real but is not a permanent feature.
And a part of the strength is concentrated in the larger integrated producers. The medium and small steel producers — secondary mills, rerollers, induction furnaces — have not yet seen the same pull-through. A demand cycle that is only running at the top of the value chain is a partial cycle, not a full one.
How to triangulate
A reader who wants to know whether April was a flash or a turn should watch four data points over the next eight to ten weeks.
The first is the cement print for May. Cement and steel are co-incident with each other but lag the underlying construction decision by similar windows. If May cement demand also prints near 8 per cent, the construction story is real.
The second is bank credit to industry. The MSME and large-industry credit lines should accelerate in line with the capex cycle. If bank credit to industry remains soft while steel demand stays firm, the steel story is being driven by inventory effects rather than fresh investment.
The third is capital-goods imports. India still imports a meaningful share of its high-end industrial machinery. A real private capex cycle will show up in the customs data as rising capital-goods imports two to three months after the steel orders begin.
The fourth is Indian listed-corporate capex announcements. The earnings season currently underway is the best read of corporate intent. If managements raise capex guidance into the second half of FY27, the steel print is the early signal of the build.
The macro stakes
If the April number is the start of a turn rather than a one-month surprise, the macro implications are substantial.
A genuine private capex cycle does several things at once. It absorbs the labour that the formal sector has been slow to hire. It deepens the manufacturing base in a way that the PLI scheme alone cannot. It improves the export complexity of the Indian economy in the medium term, because most of what private capex builds eventually exports. And it gives the government a fiscal break, because strong private capex reduces the political pressure to keep boosting public capex past prudent levels.
The growth base case for FY27 currently sits around 7 per cent. A real private capex cycle would push that toward 7.5, with second-order effects on employment, household income, and tax buoyancy that compound for several years.
The downside case, if April was a head-fake, is less dire. We would simply continue on the existing 6.5-to-7 per cent path, which is already a respectable trajectory by global standards.
What this article is not
This is not a buy recommendation on steel equities. The macro signal embedded in the steel print is a different question from the equity-investment question, which is governed by valuation, capacity additions, global price action, and the China steel-export overhang.
It is, however, a reminder that the most informative data point of the week was not on the front page. The headline writers were busy with the Iran war and the inflation-target debate. The economy was doing something quieter and possibly more important — building, ordering, paying invoices, and planning the next round of capex.
If you want to know what India is going to look like in late 2027, watch what it is buying steel for in May 2026.
BarathVector covers India's economy with the conviction that the most useful indicators are usually the ones the headlines miss.